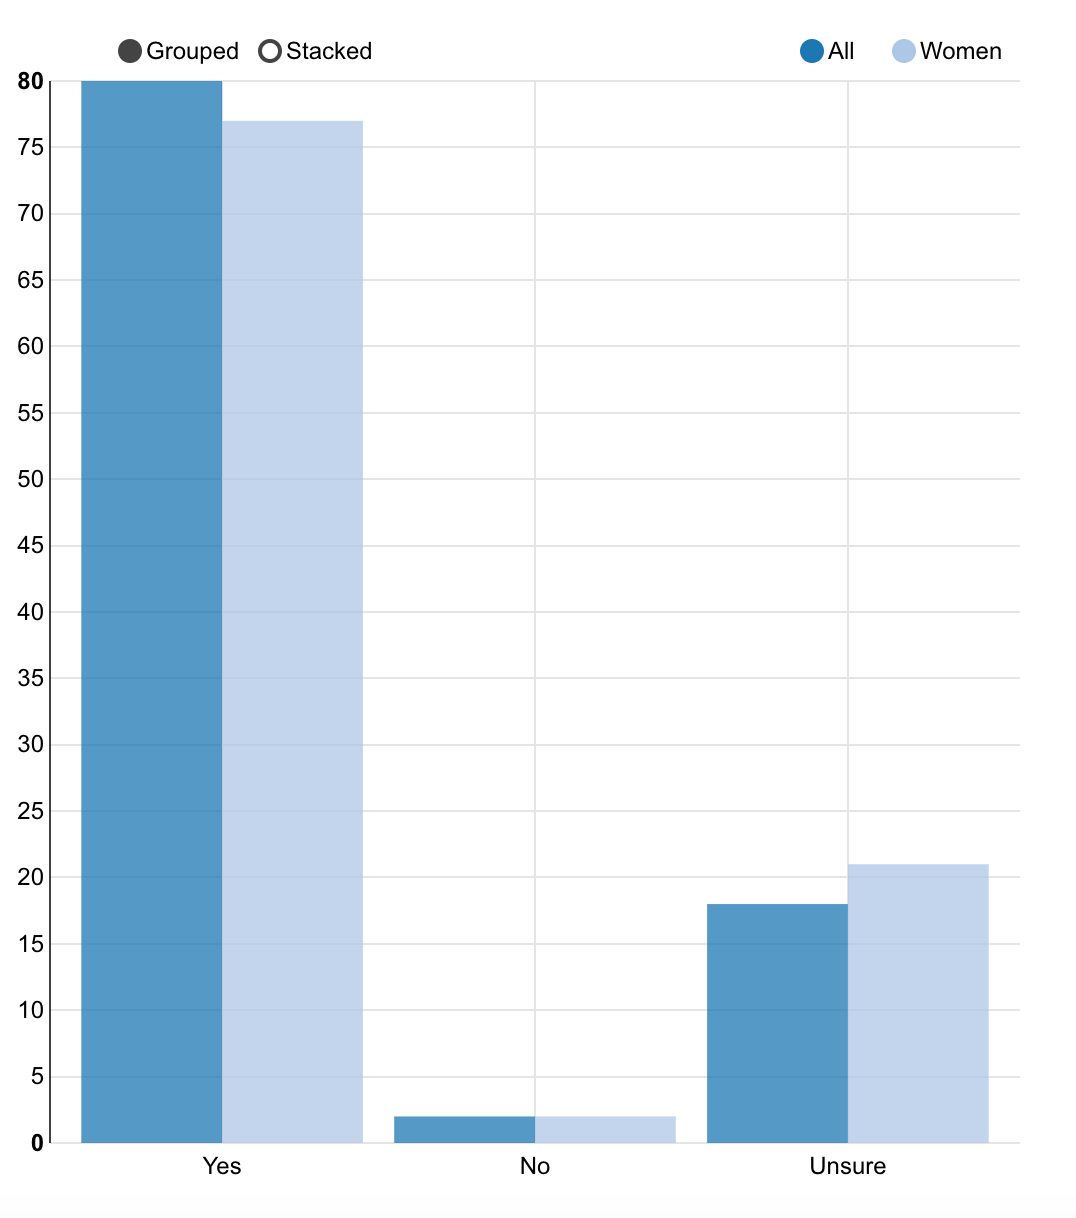
80% of the voters interviewed by PACE observers reported that voters felt free to cast a vote for the candidate or party they preferred, but women were less likely to say that voters felt free to do so, and more likely to report that they were unsure.